- Apr 22, 2024
- 12 Min
Decoding the Performance Dashboard

Discover the incredible potential of FuseBase performance dashboards from our experts!
Book a demoIn today’s quickly changing business environment, maintaining an edge requires staying in tune with every beat of your company’s heart. It’s crucial to have your finger on the pulse, tracking key performance indicators, such as sales performance, for example, and reacting swiftly to fluctuations and trends. And this is where a performance dashboard truly shines. Being powerful tools that provide real-time insights into your business operations, performance dashboards have become a must-have for those companies that want to remain competitive. In this article, we will look at what a performance dashboard is, explore its benefits and examples, as well as consider types that are reshaping the way businesses operate today.
- Concept of a Performance Dashboard
- Significance of Performance Dashboards
- 7 Benefits of Having a Performance Dashboard
- Types of Performance Dashboards
- Examples of Performance Dashboards
- FuseBase Performance Dashboard Software
- Key Elements of a Performance Dashboard
- How to Create an Effective Dashboard
- Conclusion
Understanding the Concept of a Performance Dashboard
A performance dashboard comprises an extremely useful tool that visually displays company’s key performance indicators (KPIs), performance metrics and data points such as the organization’s financial health, marketing and sales performance, sales data, etc. Its main goal is to provide a real-time snapshot of relevant and well-timed information to help businesses with monitoring and decision-making processes. Dashboards typically have an easy-to-understand format with graphs, reports, charts and tables.
A performance dashboard can be customized to fit the needs of different users within an organization. For example, an executive might have it focused on high-level KPIs, such as overall financial performance, gross profit margin, customer satisfaction and client retention, while a marketing manager might have a dashboard displaying more specific metrics related to marketing performance, for example, website traffic, social media analytics, marketing channels, conversion rates and average time on page.
Significance of Performance Dashboards
Imagine you are the captain of a huge spaceship with many people on board. Wouldn’t it be convenient to have a visual display of all the factors that could impact your voyage, such as weather conditions, internal and external temperatures, fuel levels and food supplies? That is exactly what the performance dashboard does for a company. It helps monitor critical business processes and provides relevant and timely information in the form of a metrics dashboard, allowing managers to always stay in the know and react to even the most subtle changes in trends.
- Real-Time Monitoring: One of the most significant benefits of a performance dashboard is that it provides real-time monitoring of business operations. In our fast-paced world, having access to current business data can mean the difference between a timely business decision and a missed opportunity.
- Visualizing Complex Data: Performance dashboards work as data visualization tools – they convert complex data sets into visually comprehensible formats. They display key business performance metricsand trends in charts and graphs that are easy to read and understand. This helps minimize the guesswork and improve decisions.
- Enhancing Productivity: With a performance dashboard, teams can quickly identify areas that require attention, helping them focus on the tasks that matter the most. This saves time and enhances overall productivity.
- Aligning Strategy and Goals: A performance dashboard can be customized to reflect the strategic goals of the organization. This alignment allows everyone in the team to understand their contribution towards these goals, fostering a sense of purpose and engagement.
- Identifying Trends and Insights: A performance dashboard can help identify trends and patterns over time, revealing insights that may otherwise go unnoticed. These insights can be crucial for strategic planning and forecasting.
In summary, performance dashboards are not just nice-to-have tools but a vital component of modern business operations. They facilitate real-time monitoring, business data visualization, productivity, strategic alignment and discovery of insights, all of which are integral to staying competitive in today’s dynamic marketplace.
7 Benefits of Having a Performance Dashboard
Incorporating a performance dashboard into your business operations brings numerous benefits that drive efficiency, productivity and revenue growth.
- Informed Decision-Making. A dashboard aggregates and visualizes data in real time, providing a clear and concise view of business performance. This aids in data-driven decision-making, reducing reliance on guesswork and intuition. Business performance dashboards can help analyze the root cause of problems thus improving decisions and saving time and effort.
- Time-Saving. By consolidating all critical information into one easily accessible platform, performance dashboards save time that would otherwise be spent on the manual collection of information and its analysis. A performance dashboard eliminates the necessity for a dedicated data analytics team to conduct intricate queries on a company’s SQL Server or other databases. They provide all the vital information you need readily available, streamlining the data analysis process.
- Improved Performance Tracking. A dashboard provides a centralized view of key performance indicators (KPIs), allowing for tracking performance against set targets. This can ensure efficiency and productivity, leading to significant reductions in operational costs.
- Identification of Trends. A dashboard can help decision makers identify trends and patterns, providing valuable insights that can drive strategic decision-making. This is particularly advantageous for marketing campaigns and human resources activities.
- Enhanced Communication. Performance dashboards can foster better communication within teams. With a clear view of important KPIs and performance data, teams can work collaboratively towards shared goals and targeted strategies. More than that, having a properly customized metrics dashboard helps manage people more effectively as you have full control over employee performance and can quickly react to emerging issues.
- Increased Accountability. With performance metrics visible to all relevant stakeholders, a financial dashboard, for example, can increase accountability, encouraging teams and individuals to take ownership of their performance.
- Customizability. Dashboards often comprise fully customizable tools, which makes them useful for various industries. Customization ensures everyone gets the most relevant and useful information for their role. For example, marketing teams may get information on marketing performance, conversion rates and success of their marketing efforts. Sales teams can view real-time visual representations of income, expenses, cash flow and gross profit margin, while a support team can monitor ticket volume and resolution efficiency. In essence, dashboards can benefit just about every kind of company imaginable.
Types of Performance Dashboards
Performance dashboards come in different types, each suited to different needs and purposes within an organization. Understanding these types can help you choose the right one for your business.
- Operational dashboards are designed for real-time monitoring of operations. They are often used by front-line workers and managers to quickly identify and resolve potential problems. Operational dashboards typically track short-term goals and provide reports at high frequency, often in real-time or near real-time. When considering operational dashboard examples, we can mention warehouse dashboards, inventory dashboards and PM dashboards.
- Strategic dashboards focus on long-term strategies and high-level metrics. They are typically used by executives and senior management to track the organization’s progress towards its strategic goals. These dashboards are updated less frequently, typically monthly or quarterly, and include KPIs and metrics that align with the organization’s strategic objectives. Strategic dashboard examples include conversion rate dashboards, social media metrics dashboards and customer lifetime value dashboards.
- Analytical dashboards are designed to help users analyze complex datasets to identify trends and patterns. They often include features for information exploration, such as drill-down and filtering capabilities. Analytical dashboards are often used by data analysts, business intelligence professionals and other roles that require deep data analysis. Among analytical dashboard examples we can mention social media marketing dashboards that measure campaign performance, sales performance dashboards, and SEO dashboards.
- Tactical dashboards provide a middle ground between operational and strategic dashboards. They are used to track department-specific objectives and typically include metrics that are updated on a weekly or daily basis. The tactical dashboard examples include employee performance dashboards, purchase order dashboards and supplier procurement dashboards.
By understanding these categories of performance dashboards, you can identify the right type for your needs and more effectively monitor and manage your organization’s performance.
Examples & Templates of Performance Dashboards
We have already talked a little about performance dashboard examples but let us dive deeper into the topic and look at even more examples.
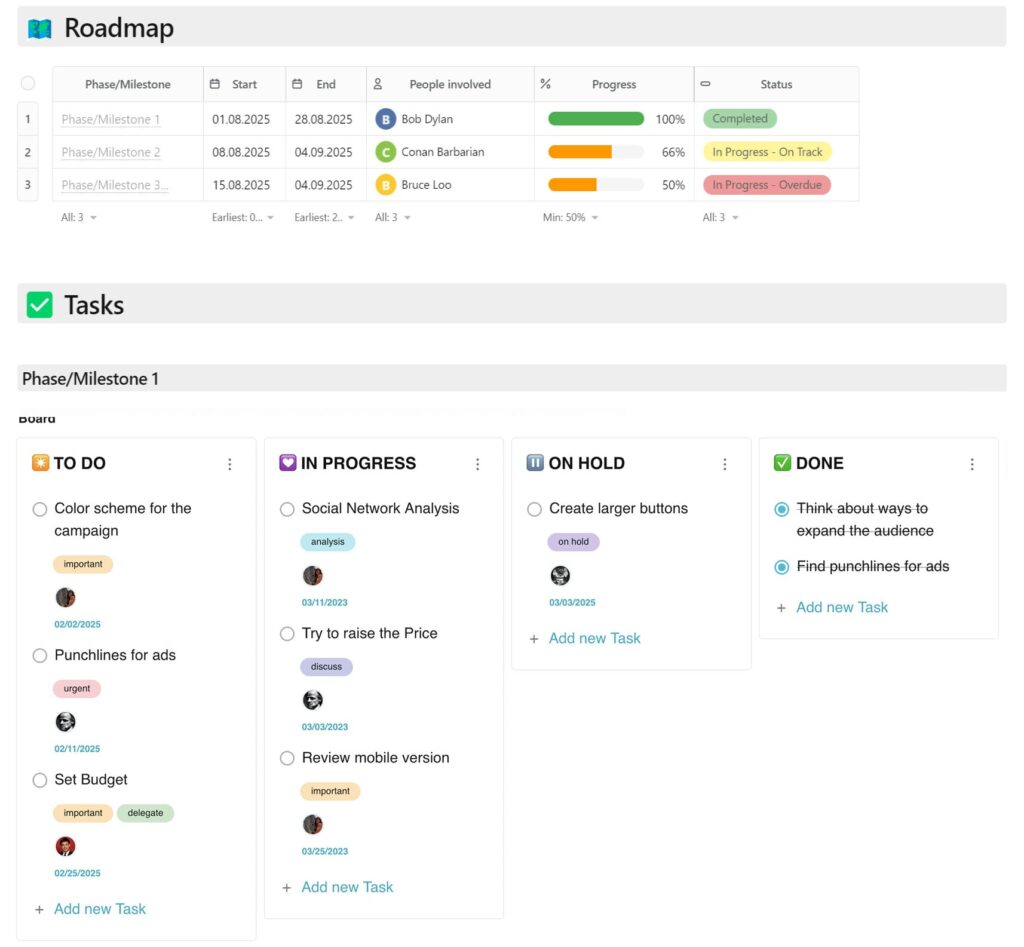
A business performance dashboard provides a comprehensive visual representation of key metrics and data to enable informed decision-making and strategic planning.
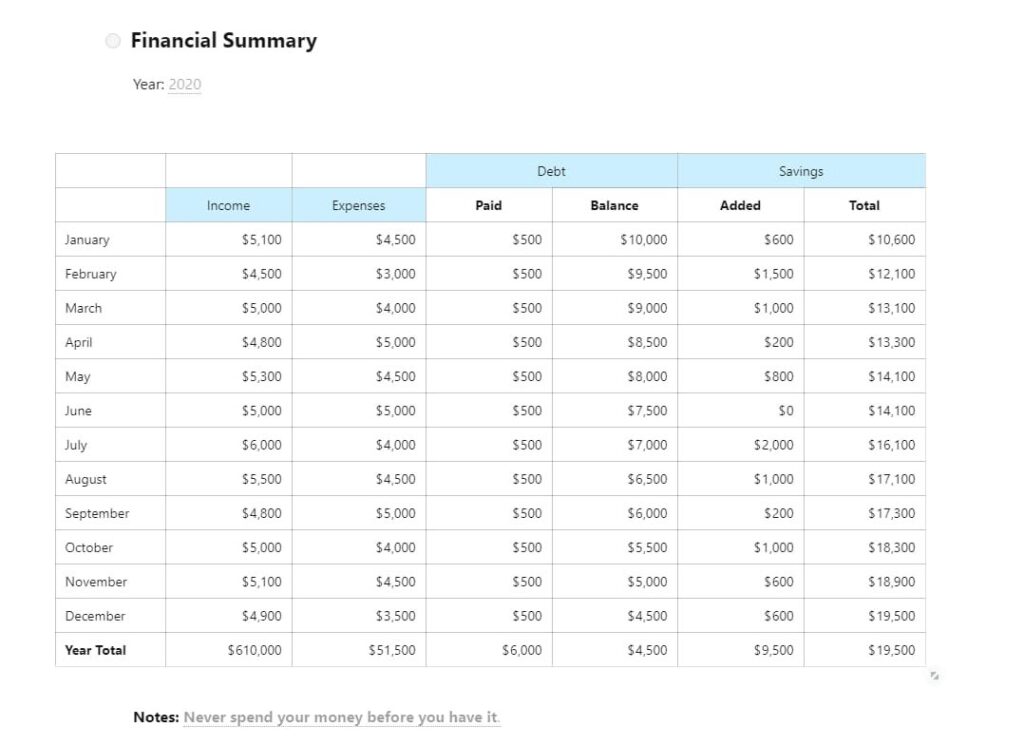
A financial performance dashboard offers a consolidated view of critical financial metrics and indicators, aiding in monitoring and analyzing the financial health and effectiveness of a business.
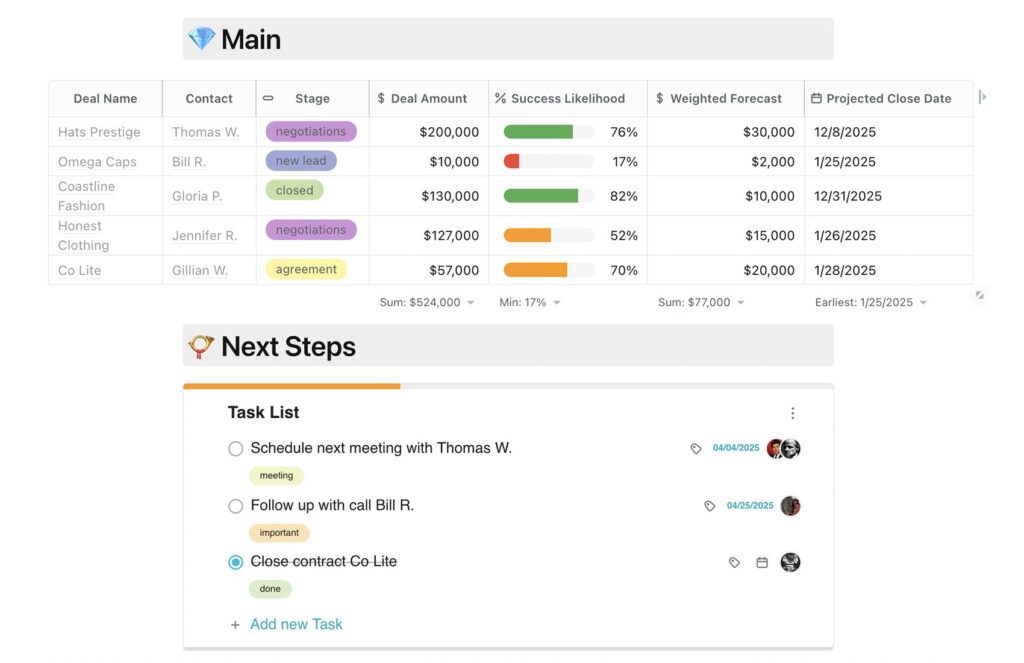
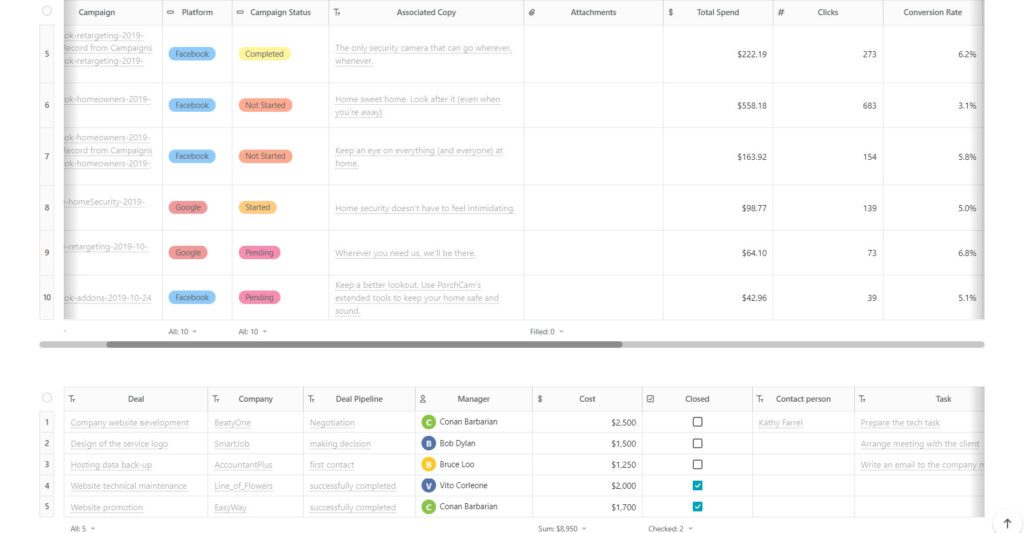
A sales performance dashboard presents real-time sales data and performance metrics, empowering businesses to track and analyze sales performance trends, monitor critical business processes and optimize sales strategies to increase profits.
A marketing performance dashboard provides a consolidated view of key marketing metrics and data, enabling marketers to assess the effectiveness of their campaigns, evaluate the conversion rate, track ROI and make data-driven decisions to optimize marketing strategies.
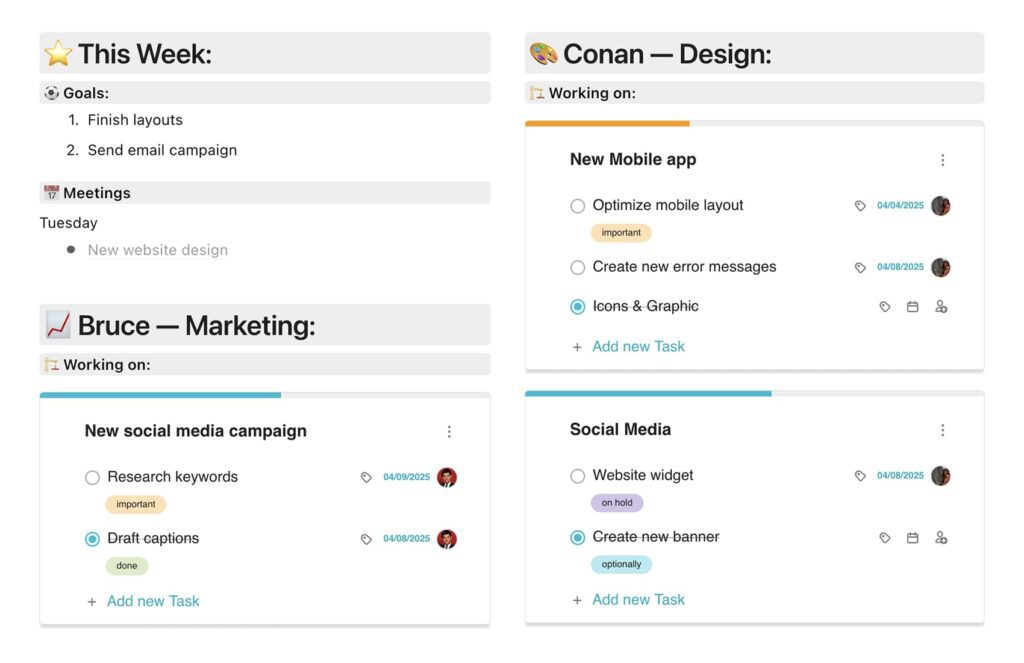
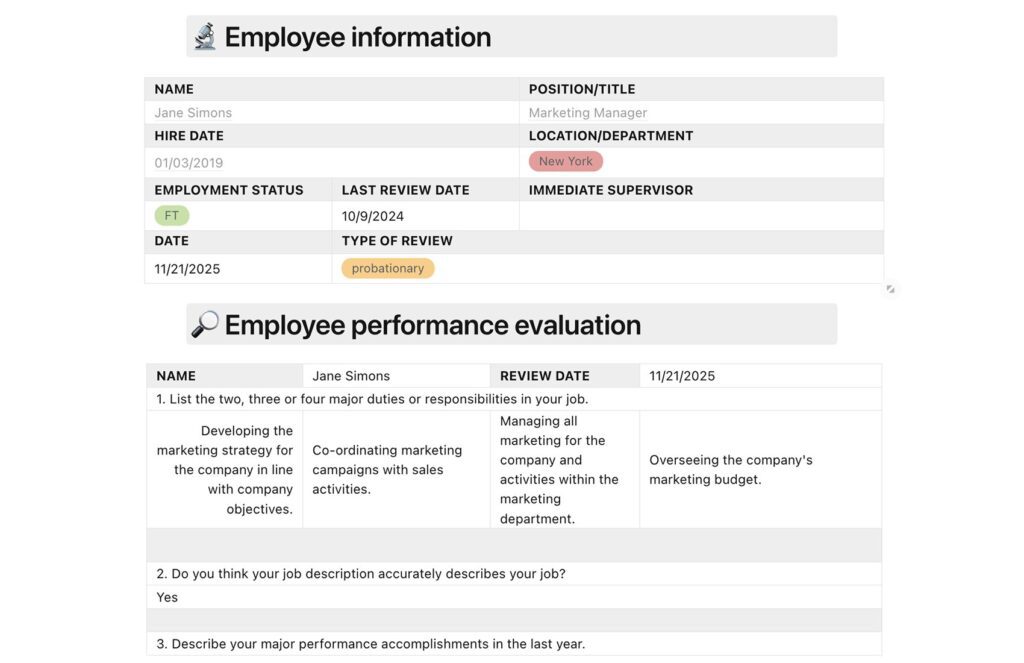
An employee performance dashboard displays key performance indicators and metrics, enabling managers to manage people effectively, evaluate individual and team performance, and identify areas for improvement.
These are just some of the performance dashboard examples; you can find more performance dashboard templates at FuseBase templates gallery.
FuseBase Performance Dashboard Software
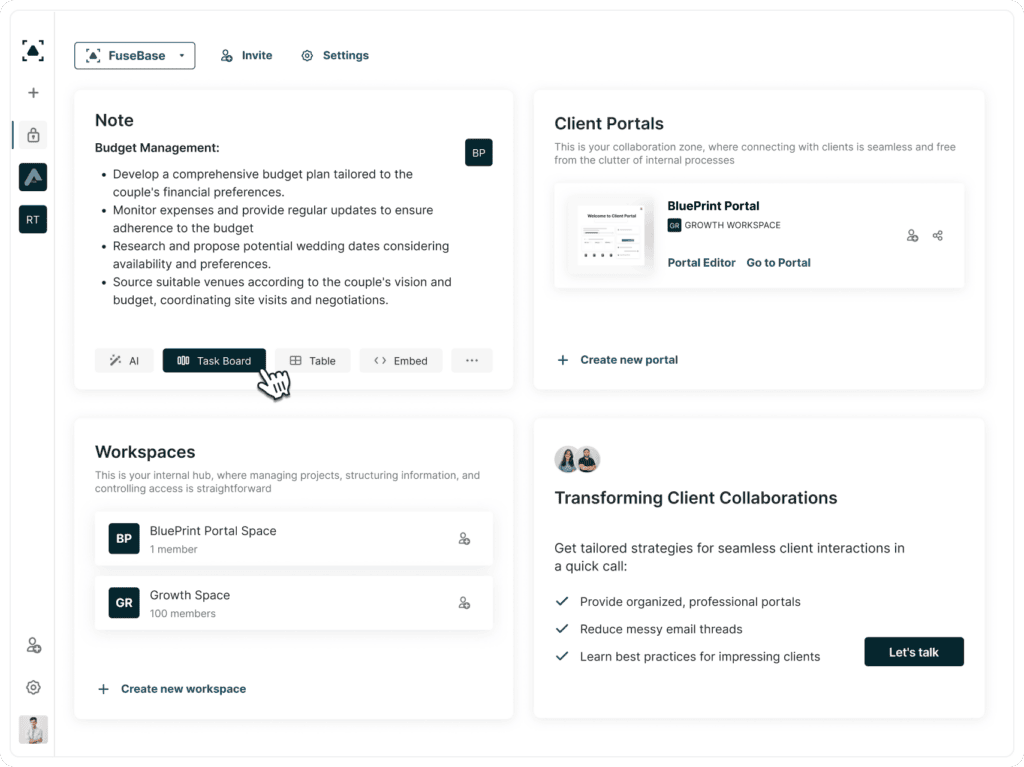
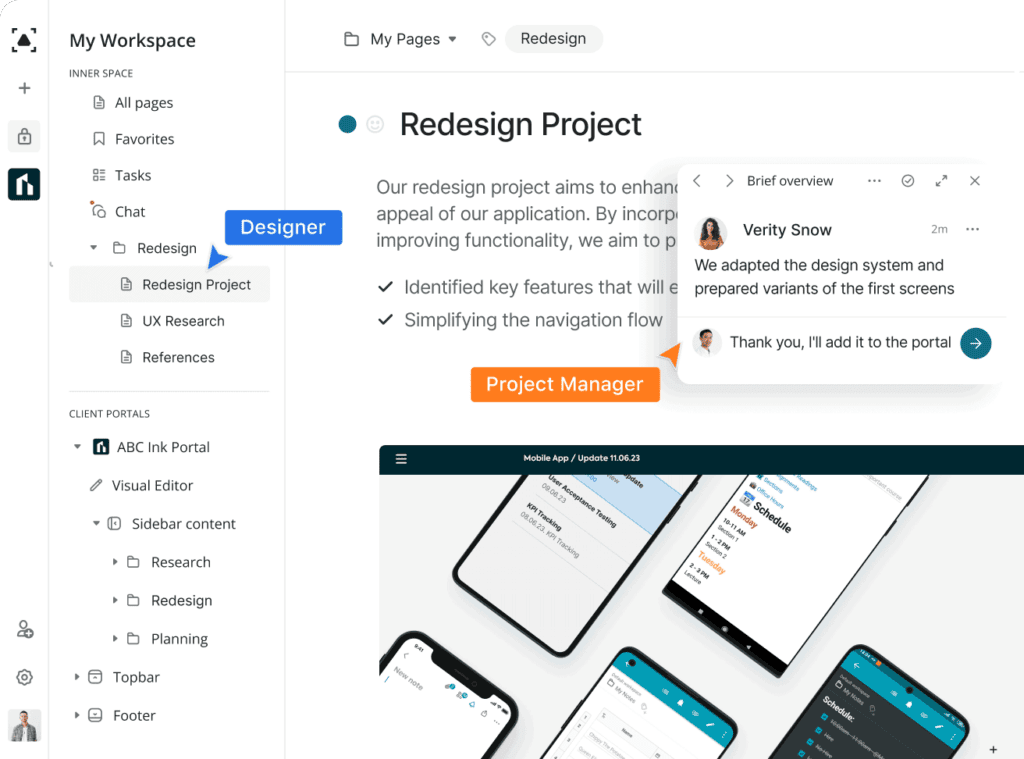
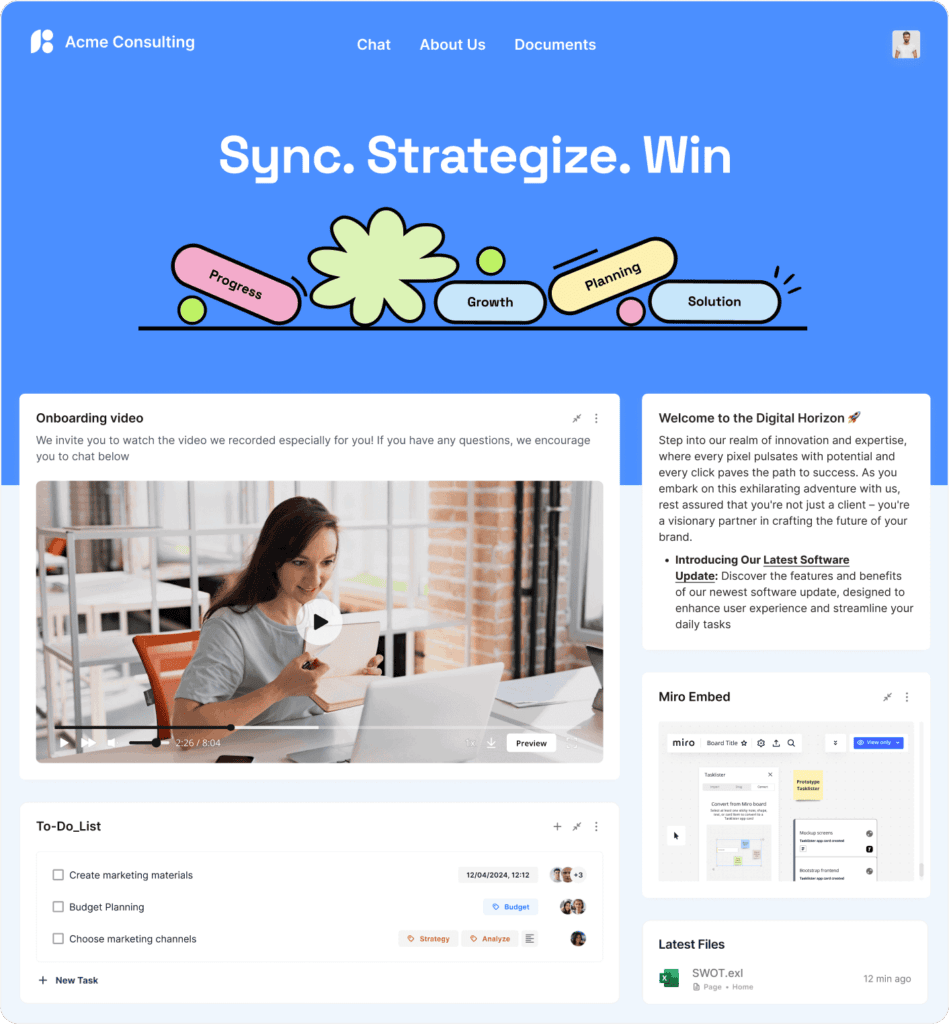
FuseBase (formerly Nimbus) comprises a powerful project management tool that allows you to turn your document into a dynamic performance dashboard, offering a customizable central view of your project. With FuseBase, you have the flexibility to create a traditional-style performance dashboard within the vendor portal or even in a note, customizing boxes, tables, employee information and digital data with drag-and-drop ease.
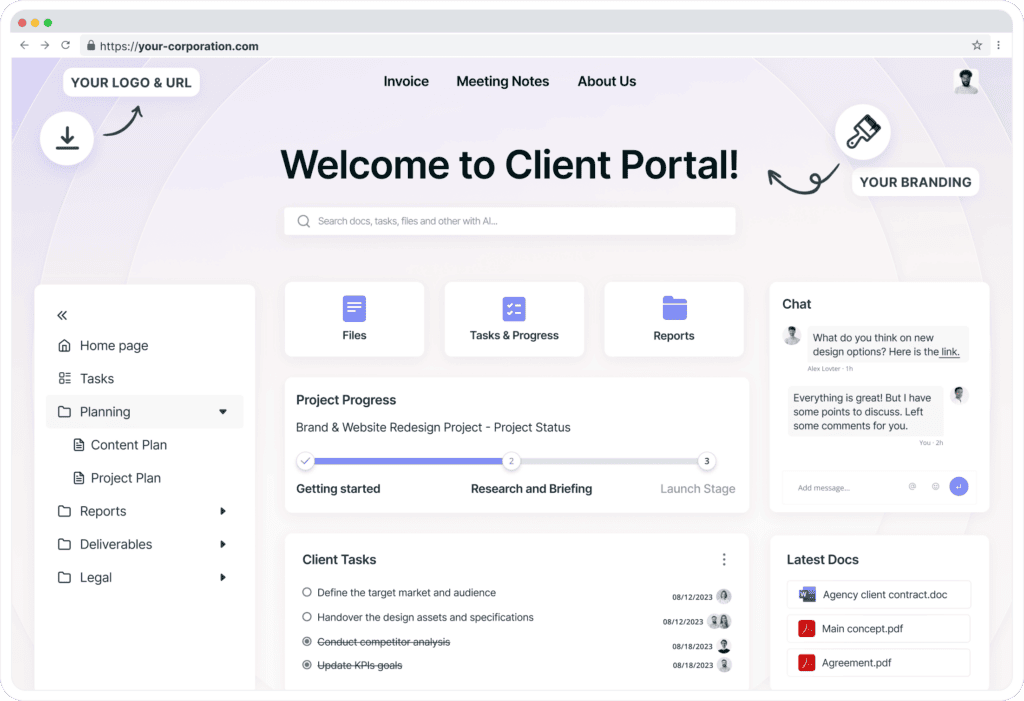
Additionally, you can integrate third-party resources to include specific performance statistics and graphs, such as Google Analytics, for example, which will help you gather and consolidate various data types from different services into a single, centralized location.
Unlock your business success with FuseBase workspace!
Key Elements of a Performance Dashboard
To create an impactful performance dashboard, certain key elements should be considered. These elements ensure that the dashboard provides clear and actionable insights. Here are some essential components:
- Relevant KPIs: Identify the most important KPIs that align with your business objectives and tasks. Select KPIs that are specific, measurable, achievable, relevant and time-bound (SMART) to track the performance accurately. For example, a sales performance dashboard might include the following indicators: revenue, sales growth, average deal size, sales pipeline, sales velocity, win rate, customer acquisition cost (CAC) and sales breakdown by region or product/service.
- Clear Visualizations: Use visual representations, such as charts, graphs, reports and tables to present reports in an easily understandable format and get full control over your data. Choose visualizations that effectively communicate trends, comparisons and progress towards goals.
- Real-Time or Near Real-Time Data: Display information that is updated frequently, either in real-time or with minimal delay. This ensures that decision-makers have the most current metrics to monitor performance and respond promptly.
- Customization: Tailor the dashboard to cater to the needs of different stakeholders. Allow users to customize their views, choose specific metrics and arrange the layout based on their roles and responsibilities.
- Drill-Down Capability: Provide the ability to drill down into specific data points for deeper analysis. Users should be able to explore details and identify the underlying factors impacting performance.
- Performance Alerts: Implement alerts or notifications to draw attention to critical deviations or thresholds. Alerts can notify users when certain KPIs cross predefined thresholds, enabling proactive decision-making.
- Comparative Analysis: Include features and tools that allow for benchmarking and comparative analysis. This helps users assess performance against historical data, targets, industry standards or competitors.
- Mobile Compatibility: Ensure that the performance dashboard is accessible on mobile devices. This allows users to monitor performance on the go and make informed decisions anytime, anywhere.
- User-Friendly Interface: Design an intuitive and user-friendly interface that allows users to navigate and interact with the dashboard effortlessly. Keep the layout clean, uncluttered and organized for optimal usability.
How to Create an Effective Dashboard
Designing an effective dashboard involves thoughtful planning and consideration of user needs. Follow these best practices to create a dashboard that will provide meaningful insights and improve decisions:
1. Define Objectives and Select the Right Tools
Clearly define the purpose, tasks and objectives of your dashboard. Identify the key questions you want to answer and the specific metrics that align with your goals. Having defined the objectives, you can choose the appropriate dashboard tools that align with your specific needs and goals.
2. Get to Know Your Audience
Analyze your audience to find out who will be using the dashboard and their specific needs. Tailor the dashboard to their roles and responsibilities to ensure the information presented is relevant and actionable.
3. Select the Right Metrics
Choose the most relevant and impactful metrics that align with your tasks and objectives. Focus on key performance indicators (KPIs) that provide a clear understanding of performance.
4. Keep it Simple
Avoid information overload by keeping the dashboard simple and uncluttered. Use clear and concise visualizations to present data effectively. Remove unnecessary elements that can distract from the main message.
5. Provide Context
Present reports in the context of historical data, targets or benchmarks. Use trend lines, goal indicators or color-coded thresholds to provide context and aid interpretation.
6. Design for User-Friendliness
Create a user-friendly interface that is easy to navigate. Ensure intuitive interactions and provide clear instructions for using the dashboard effectively and avoiding potential problems with the dashboard utilization.
7. Emphasize Visualization
Utilize visualization tools such as charts, graphs and tables to present data in a visually appealing and easily understandable format. Choose the most appropriate visualization type for each data point.
8. Ensure Data Accuracy
Analyze and verify the accuracy of the data displayed on the dashboard. Use reliable data sources and establish data governance practices to maintain data integrity.
9. Test and Iterate
Test the dashboard with a sample group of users and gather feedback. Iterate and make improvements based on user examples to enhance usability and effectiveness.
10. Regularly Update and Maintain
Keep the dashboard up to date with fresh data to ensure relevancy. Regularly review and refine the dashboard to accommodate changing business needs and user feedback.
Conclusion
The significance of performance metrics and their monitoring cannot be overstated in today’s business world. A performance dashboard allows delving into the root cause behind any critical situation a business might have. Dashboard tools allow visualizing data and metrics of any kind: indicators of sales performance, Google Analytics data, conversion rate percentage, average order values, overall sales figures, etc. All this enables businesses to make data-driven decisions and optimize their operations for enhanced success. Performance dashboards serve as indispensable tools that consolidate vital information, empowering businesses to stay competitive and thrive in an ever-evolving market. Among other performance dashboard examples, FuseBase (formerly Nimbus) stands out for its user-friendliness, ease of use and integration capabilities.
Visit our LinkedIn page for more news and updates!